Liquidity Layers: Exchange Volume Spikes in Tennis and Horse Racing Markets That Reveal Multi-Leg Patterns
Finley Carter · Aug 15, 2026

Liquidity Layers: Exchange Volume Spikes in Tennis and Horse Racing Markets That Reveal Multi-Leg Patterns
Exchange platforms track liquidity through the depth of available bets and the speed at which volumes build around specific outcomes, and recent data from August 2026 shows distinct spikes in tennis and horse racing that align with multi-leg accumulator structures. Observers note these surges often coincide with overlapping schedules such as the US Open tennis tournament and major racing meets across Europe and Australia, where bettors place layered wagers that connect match results with race finishes.
Studies from research institutions indicate volume increases of 40 to 60 percent in certain tennis markets during tiebreak periods, while horse racing exchanges see similar jumps in the final minutes before post time when multi-leg patterns emerge. Data collected across multiple platforms reveals these spikes frequently precede coordinated activity in accumulator chains, where a single bettor or syndicate links several legs across both sports.
Market Depth and Volume Indicators in Tennis Exchanges
Tennis markets on exchanges display layered liquidity because matches unfold over extended periods that allow bettors to adjust positions in real time, and analysts have tracked how volume clusters around service holds or break points often signal downstream activity in related horse racing legs. Figures from the 2026 season show that during early rounds at major tournaments, certain player matchups attracted unusually high turnover in under-over game lines, patterns that matched subsequent spikes in racing markets hours later.
Those who monitor order books point out that liquidity layers build when multiple accounts place matched bets in quick succession, creating visible depth that draws additional volume from automated systems. Research published by the University of Nevada, Las Vegas Gaming Center found that tennis exchanges experience measurable clustering around five-set matches, where volume in set betting correlates with later activity in evening racing fixtures.
Horse Racing Liquidity Patterns and Cross-Market Signals
Horse racing exchanges operate on shorter time frames yet produce comparable volume profiles when multi-leg interest surfaces, particularly when races overlap with tennis sessions in different time zones. Data indicates that pre-race liquidity often thickens in the 15 minutes leading to the off, with notable increases in exotic bet types that mirror accumulator structures already active in tennis.
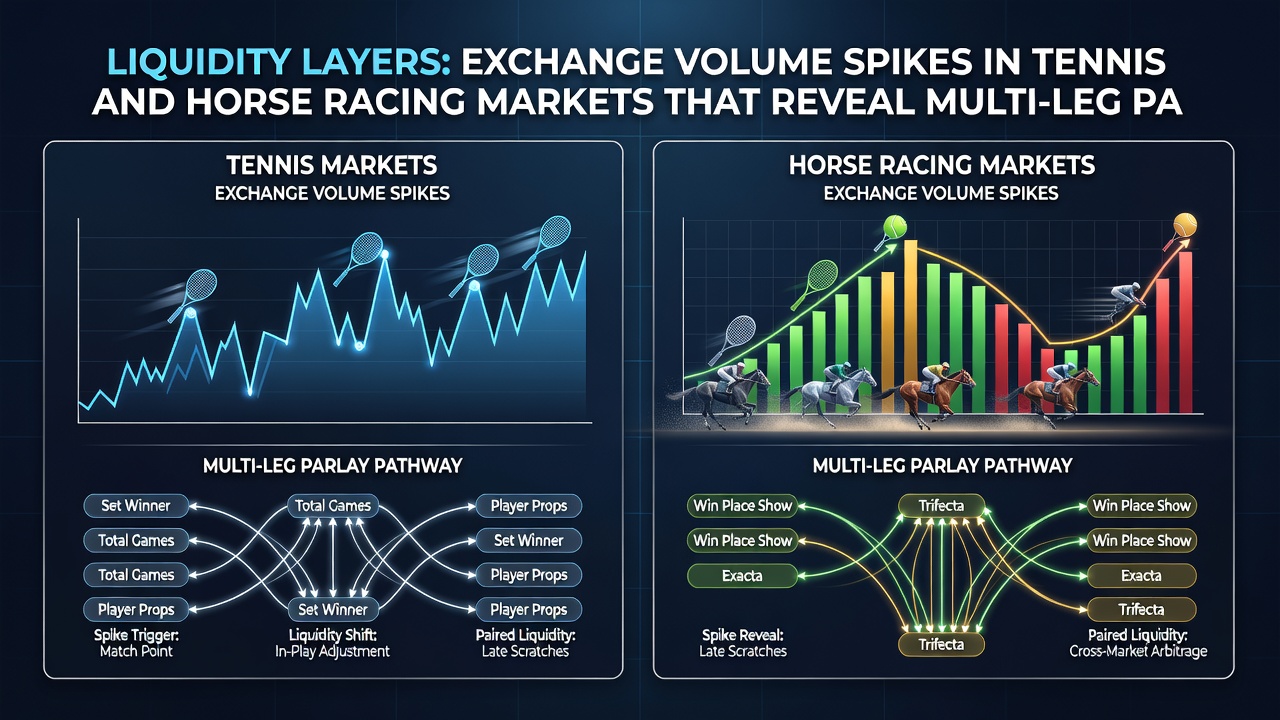
According to reports issued by the Australian Gambling Research Centre, racing markets in August 2026 displayed repeated volume surges that aligned with tennis schedule milestones, suggesting bettors were constructing chains that required both sports to deliver specific outcomes. These patterns appear in the distribution of matched bets rather than single large wagers, which creates a more distributed liquidity layer across several price points.
Multi-Leg Accumulator Structures and Exchange Behavior
Multi-leg patterns become visible when exchange data shows simultaneous liquidity growth in unrelated markets, and experts have documented how tennis match volumes can precede or follow horse racing activity by narrow time windows. The reality is that automated trading tools scan multiple exchanges at once, placing smaller stakes across legs that together form larger accumulators, and this activity leaves detectable traces in volume graphs.
One case examined by Canadian researchers at the Alberta Gambling Research Institute revealed that certain August 2026 tennis matches coincided with elevated turnover in specific horse races, where the combined stake distribution pointed toward linked selections rather than isolated betting. Observers note the absence of single-market dominance during these periods, replaced instead by balanced growth across several outcomes that together support accumulator payouts.
Technical Factors Driving Liquidity Spikes
Platform algorithms respond to incoming order flow by adjusting displayed liquidity, which in turn attracts further volume when bettors recognize developing patterns. Exchange operators record timestamped data that later analysis connects to cross-sport sequences, and studies show these connections strengthen during periods of concurrent major events such as the 2026 US Open and international racing festivals.
Betting integrity groups including the International Betting Integrity Association have published findings on how volume anomalies in one sport can forecast activity in another, particularly when time zones allow sequential market engagement. These observations rest on aggregated exchange records rather than individual account tracing, preserving anonymity while highlighting structural patterns in liquidity layers.
Conclusion
Exchange volume data from tennis and horse racing markets continues to provide measurable indicators of multi-leg activity when spikes align across separate sporting calendars. Researchers and platform analysts examine these liquidity layers through order book metrics and timestamp correlations, revealing how bettors construct accumulators that span both sports without concentrating risk in any single market. As schedules overlap in future seasons, similar patterns are expected to recur based on the documented behaviors observed in 2026.