Mapping Recovery Windows: Tennis Five-Set Battles and NBA Back-to-Back Games Offer Insights for Football Injury Reports and Racing Form
Finley Carter · Aug 22, 2026
Mapping Recovery Windows: Tennis Five-Set Battles and NBA Back-to-Back Games Offer Insights for Football Injury Reports and Racing Form
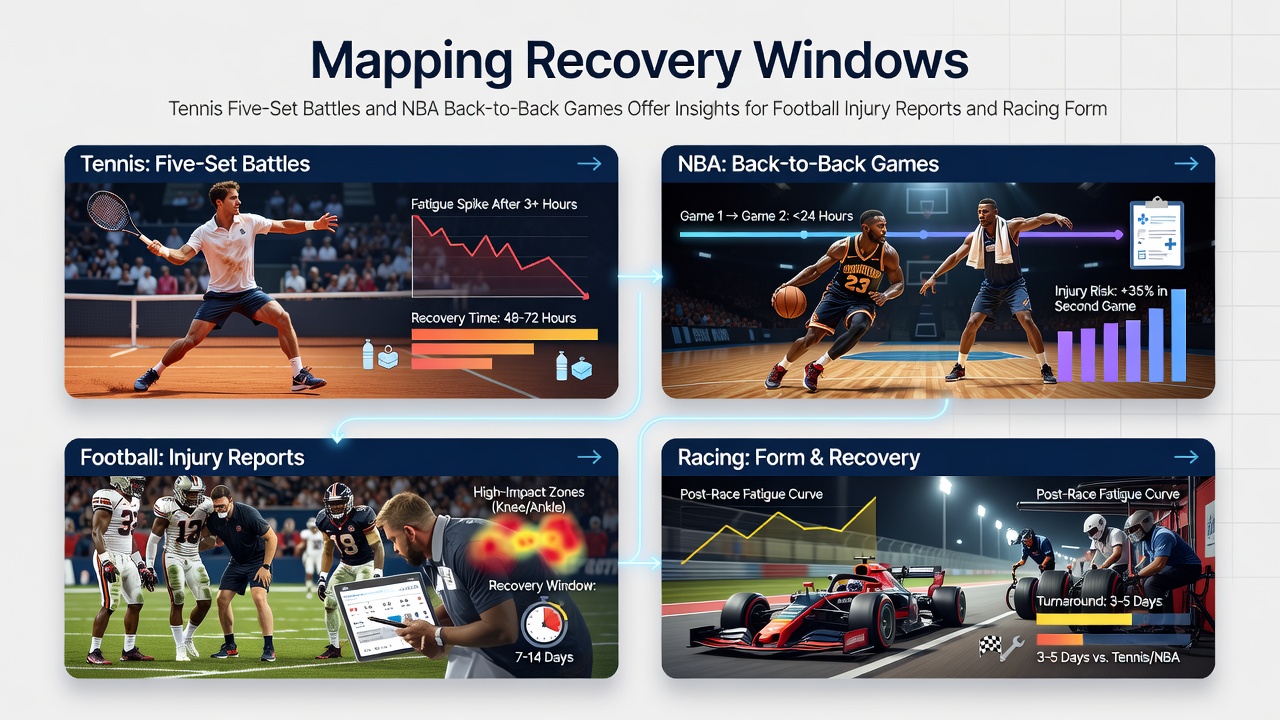
Recovery timelines in high-demand sports create measurable patterns that extend across disciplines, and researchers track these windows through performance metrics collected after extended tennis matches and consecutive NBA contests. Data from multi-hour tennis encounters and back-to-back basketball schedules show consistent drops in speed, decision-making accuracy, and muscle response that last between 48 and 96 hours depending on age, prior workload, and environmental factors. These intervals supply reference points for football medical teams compiling injury reports and for racing analysts evaluating horse readiness on subsequent starts.
Tennis Five-Set Matches and Physiological Load
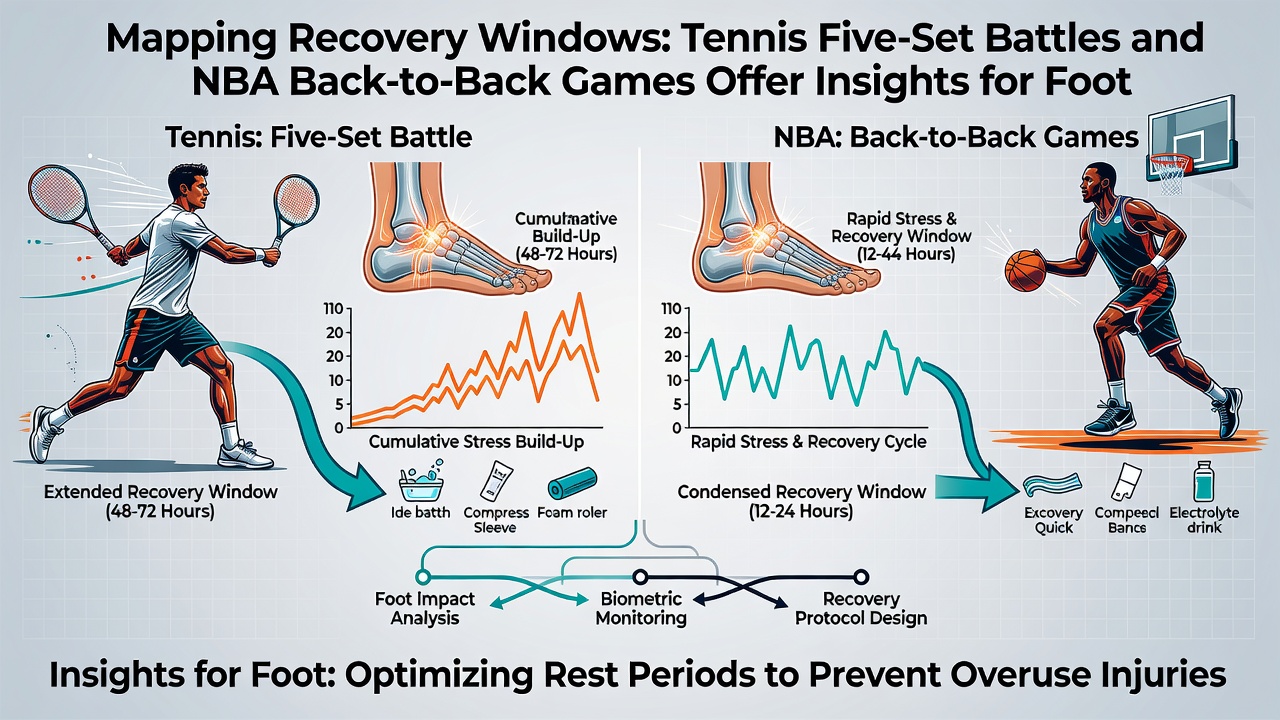
Grand Slam five-set matches often exceed three hours of continuous effort, and studies compiled by sports science groups document elevated creatine kinase levels and reduced serve velocity persisting well into the following day. Players who compete in such contests on hard courts during late summer schedules experience measurable declines in lateral movement efficiency, with recovery curves steepest between 36 and 72 hours post-match. In August 2026 the US Open schedule places several marquee encounters within tight turnaround windows, allowing analysts to compare baseline movement data against post-match outputs captured by Hawk-Eye systems. Observers note that second-week participants who survive multiple five-setters show elevated soft-tissue complaint rates in the subsequent fortnight, patterns that align with workload thresholds identified in longitudinal athlete monitoring programs.
NBA Back-to-Back Scheduling Effects
NBA teams playing consecutive nights record average reductions in points per possession and defensive rating that peak on the second evening and remain detectable through the next 48 hours of rest. League tracking data indicate that travel distance above 1,000 miles combined with back-to-backs amplifies these decrements, while younger rosters rebound faster than veteran groups. Medical staff use heart-rate variability and jump-test outputs to flag elevated risk windows, and these same biometric markers have been adapted for use in other team sports facing compressed calendars. When the league releases its 2026-2027 schedule in August, analysts cross-reference historical back-to-back clusters against injury report archives to forecast probable absences.
Transferring Metrics to Football Injury Reporting
Football clubs already collect GPS-derived workload figures, yet cross-sport comparisons add context when a midfielder logs high-intensity minutes across midweek European fixtures and weekend league games. Patterns observed after tennis marathons and NBA doubleheaders suggest that cumulative load exceeding established thresholds correlates with hamstring and ankle complaint spikes 48 to 72 hours later. Injury reports issued by Premier League and Bundesliga medical departments list players as doubtful when recent match counts align with these documented recovery curves. European sports medicine conferences have presented aggregated datasets showing that teams adjusting training loads within 60 hours of heavy fixture congestion reduce soft-tissue incidents by measurable percentages, according to figures released by the National Institutes of Health athlete monitoring reviews.
Application to Racing Form Evaluation
Thoroughbreds also exhibit performance decrements after demanding efforts, and handicappers examine post-race recovery intervals that parallel the 48-to-96-hour windows seen in human athletes. Horses returning from Group 1 contests or long-distance trials often post slower sectional times on their next outing unless given adequate rest, with data from Australian and North American racing jurisdictions indicating that three-year-olds require longer intervals than older campaigners after peak-effort runs. Form compilers integrate these observations into official ratings, adjusting expected times when a runner's schedule compresses recovery periods. In August 2026 several major summer festivals fall within tight sequencing that mirrors congested tennis and basketball calendars, allowing direct comparison of speed figures before and after short-turnaround races.
Integrated Monitoring Approaches
Practitioners combine heart-rate recovery, neuromuscular testing, and subjective wellness scores across the referenced sports to build predictive models. Football clubs and racing stables that adopt similar multi-metric dashboards report earlier identification of athletes or horses operating below baseline capacity. Research coordinated through the Australian Institute of Sport demonstrates that standardized recovery thresholds derived from tennis and basketball datasets improve forecast accuracy when applied to intermittent sports and equine athletes alike. These models update weekly as new match logs and race results enter central databases.
Conclusion
Recovery window mapping draws on established physiological responses recorded after tennis five-setters and NBA back-to-backs to refine injury projections in football and form assessments in racing. The same 48-to-96-hour intervals that govern human athlete readiness also shape equine performance expectations, and ongoing data collection through 2026 continues to tighten these cross-sport correlations. Medical and handicapping communities apply the resulting benchmarks to daily decision frameworks, producing more precise status reports and speed ratings without reliance on isolated sport-specific observations.